This is the fourth year where we have been monitoring the photography industry here on LensVid. Before we get into the real numbers we want to share with you our experience during last year’s Photokina event (check out our extensive coverage here). This was the third Photokina show that we have been to and it was very different from the ones in 2010 and 2012. It wasn’t just the general atmosphere, the show was not just smaller with far fewer products and companies presenting – there were also far, far fewer people on the show-floor during the expo. Actually at times it looked as if some of the booths were almost empty especially, the ones of some of the major manufacturers (the Fujifilm booth on the other hand was always packed which is something that we remember clearly).
Now this was only our subjective impression, however as we shall see in a moment this impression of ours seems to be backed by some hard data from the industry as a whole in 2016.
We have updated our Camera industry infographics to include the information CIPA – the camera and Image products Association recently published about the camera industry in 2016 (see cameras here, lenses here; do note that the CIPA numbers in this table come from the data members of CIPA transfer to the organisation – these members are comprised for the most part of Japanese manufacturers).
Our 2016 infographic looking into the camera industry
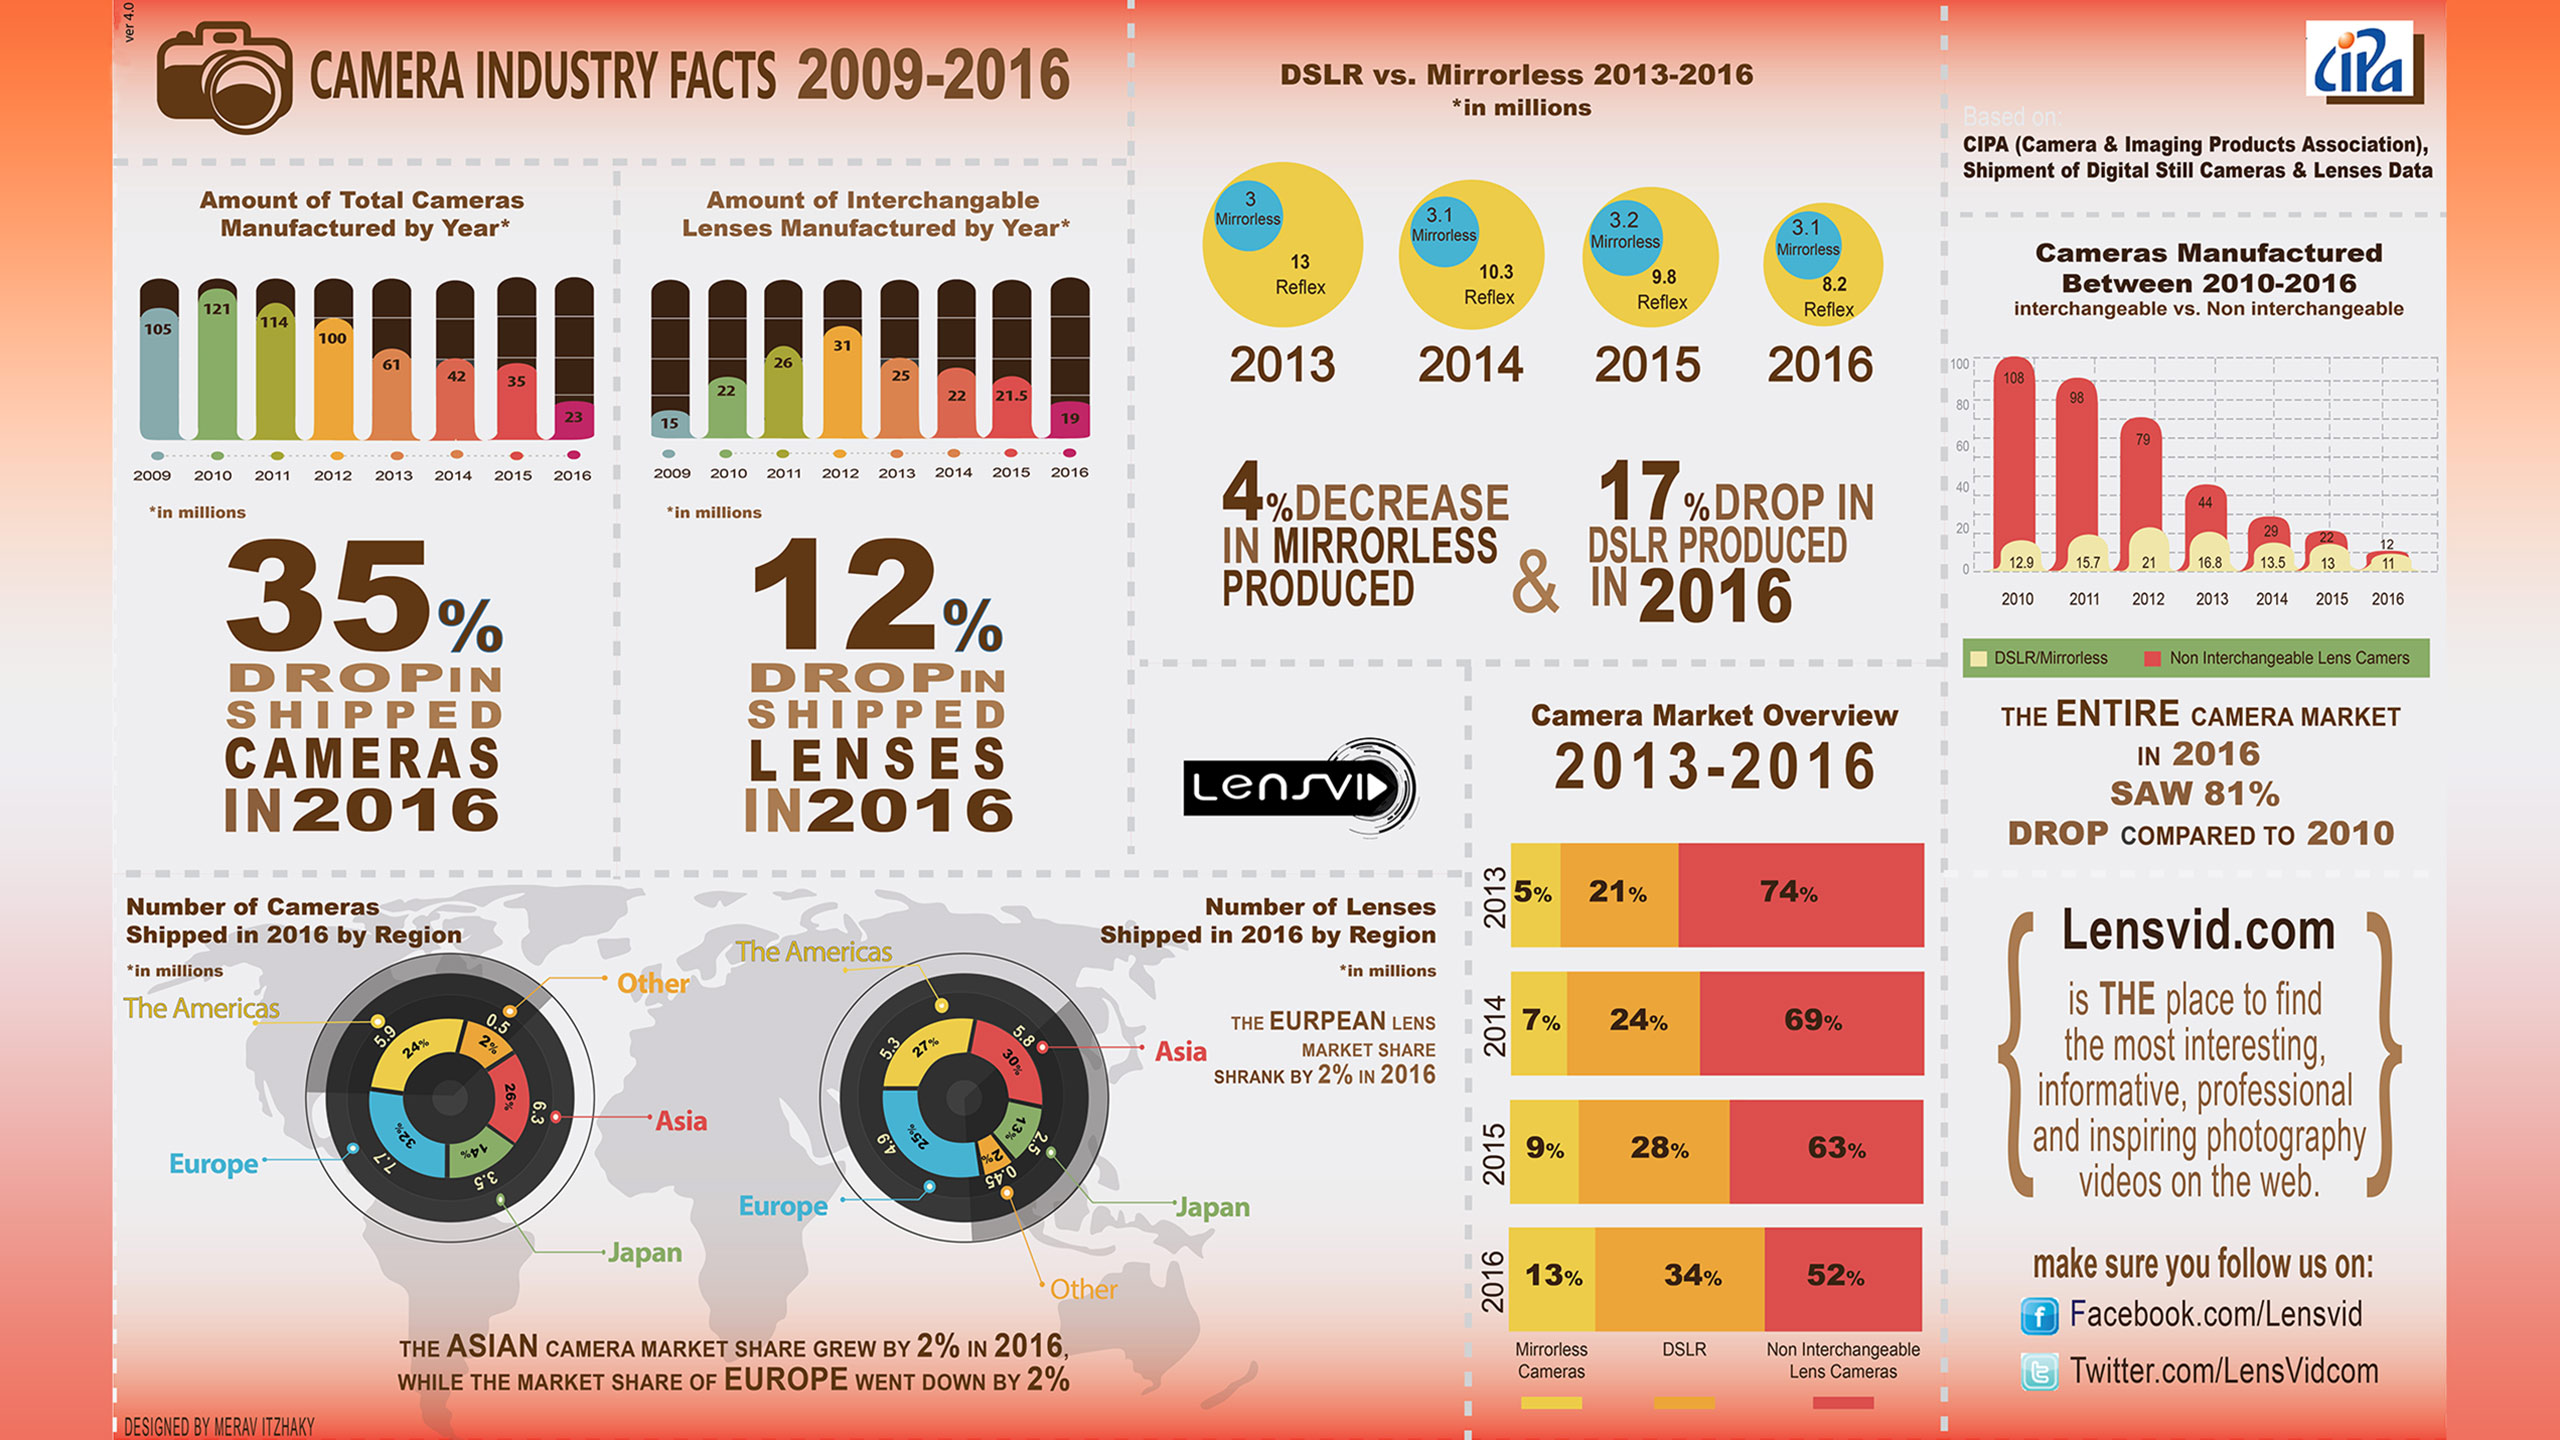
We shall start in the top left and the amount of cameras produced worldwide. 2010 was the top year ever for the camera industry with 121 million cameras that were produced, since than we have seen a steady decline with a huge drop in 2013 to only 61 million cameras – basically half, and in 2015 we saw another (almost) halving to only 35 million cameras and the most recent number from 2016 brings another huge drop to only 23 million cameras or 35% drop – year-to-year – twice as much as what happened the year before.
We will talk about the reasons behind all this later on, but let’s look at some more numbers first. If in 2015 the camera market was comprised of 22 million non interchangeable or basically compact cameras and 14 million cameras that can change lenses, in 2016 the compact camera market was almost sliced in half to only 12 million but the interchangeable camera market also took a beating with a drop to 11 million.
If you think that this only happens with DSLRs while mirrorless are on the rise – think again. In 2016 we saw a giant 17% drop in DSLR production but we also seen a 4% drop in mirrorless. In terms of lenses manufactured worldwide we also see a big drop in 2016 – from 21.5 million to only 19 million – the lowest number since 2009 and a 12% drop from the year before.
We also have some numbers in our infographics information on shipment of cameras to different regions of the world which you can look at if you are interested in this sort of data but to be honest it is just bad across the board.
One trend which is clear – as the camera market shrink again and again DSLRs and mirrorless cameras take a larger share and in 2016 these cameras almost reach 50% of the total market and it is very likely that this year will be the first year in recent history when interchangeable lens cameras will sells more than compact cameras.
So what do all these numbers really mean for the photography industry and to us as photographers? Here are a few points to think about:
- Smartphones killed the compact camera market – from over 100 million compact cameras sold in 2010 we will most likely see under 10 million sold in 2017. Just for reference, in 2016 the global sales of smart phones reached 1.5 billion units, an increase of 5 percent from 2015.
- Mirrorless are not fulfilling their promise – mirrorless are making lots of noise in the photo industry but looking at the numbers they have been more or less stagnant for the past 3 years at around 3 million cameras per year – far from impressive numbers.
- The DSLR market is shrinking – this was to be expected but it is not because of the rise of mirrorless. Why this is happening is probably a combination of reasons – at the entry level some people who might have considered buying a DSLR a few years back just settle for their smartphone camera which is better than ever and will soon improve even further with dual cameras, smart zoom technologies and more advanced features. At the mid to high end segments – there just isn’t enough innovation to justify replacing gear as often as it used to be and on the more positive side – cameras are quite reliable and replacing a working camera for a new one which doesn’t offer significantly more, just doesn’t make sense to many users.
- Cameras are for older people – you can’t see this in the numbers but we clearly see this all around us – aside from the professional segment – dedicated cameras do not interest the younger generation. The people who are still interested in photography are typically around the ages of 40-60 or more – the same people who maybe shot with analog cameras as youngsters and now have the time and money to invest in photography as a hobby – their children and grandchildren are far less interested in cameras and prefer to use their smartphones.
So what this all means for the future?
On our previous report on the camera industry we were a bit over optimistic and suggested that in 2016 we will at least see a small increase in DSLR and mirrorless sales – this obviously did not happen. Instead we just see the market shrink more and more.
So this time around we will be more cautious and say this:
- In 2017 we can safely predict that the entire global market for cameras will drop below 20 million cameras (or 1/6 of what it was in 2010).
- Over the next couple of years camera manufacturers will continue to cut jobs – just like Nikon recently did after their announcement on major financial loses.
- We will also see less innovation as less and less free money will be available for R&D.
- The professional segment will get much more attention and camera and gear prices will increase (as production costs will rise due to the decreased production levels).
- Can all the existing camera manufacturers survive this change in the market? so far most of them did, barely. However given the fact that this market will likely never return to the levels that we have seen in the beginning or even in the middle of the decade – we will not find it surprising at all if one or more of the main manufacturers will not be with us before the end of this decade (very much like Samsung disappeared from the market just a couple years back).
A look back at our previous reports on the camera industry:
- What Happened to the Photography Industry in 2013?
- What Happened to the Photography Industry in 2014?
- What Happened to the Photography Industry in 2015?
You can check out more LensVid exclusive articles and reviews on the following link.
You can support LensVid by shopping with our affiliate partners
Affiliates: Amazon, B&H, Adorama and E-bay.
Why should you trust us?
Great data! One thing I’d like to clarify, re: “Cameras are for older people…The people who are still interested in photography are typically around the ages of 40-60 or more”
This is true only if the definition of “camera” doesn’t include the cameras built into smartphones and drones. I certainly count those as cameras, and I count the pictures people take with them as photography.
I would just rephrase to say, “The people who are still interested in using traditional cameras for photography…”
I’m old enough to remember the transition from film to digital, and that long period of time when film photographers didn’t consider digital cameras to be real cameras…
As it says in the video: Their children and grand children prefer to use smartphones.
Hi Tony – good to hear from you here on LensVid (we tried to reach you before Photokina last year but I think you arrived just as we left).
In the video the intention was of course traditional cameras. People can and do take amazing pictures with smartphones (and drones) and those are great for everyday users (drones also for pros but they are another story). I personally don’t see pros using smartphones for their professional work (there are few exceptions of course but for the most part even if the image quality will reach acceptable levels – and it isn’t there yet for pro work – smartphones are very limited ergonomically and functionally to replace true cameras for a working photographer).
Anyway – for cameras (not smartphones) the future seems very bleak…
P.S. feel free to use this info/infographic in your next video – but let me know (I think you still have my e-mail).
Iddo
Great graphic and info. It would be interesting to overlay the number of photos taken on these graphs.
His conclusion on mirrorless is incorrect. If mirrorless sales are steady and the dslr and compact sales are shrinking, mirrorless is increasing its share of the market.
This is stated in the video and the article – watch/read again – both the DSLR and mirrorless share is increasing (mirrorless a bit more relatively).
I am looking at the summary. I read it again. I don’t feel that the following statement reflects the data you have given.
“Mirrorless are not fulfilling their promise – mirrorless are making lots of noise in the photo industry but looking at the numbers they have been more or less stagnant for the past 3 years at around 3 million cameras per year – far from impressive numbers.”
I’d suggest that it would be more accurate to say that mirrorless cameras are doing rather well to hold their sales numbers in the face of declining sales of dslr models.
Classic case of glass half empty/full – you prefer to see this as a positive – we look at it as a negative (especially when compared to previous predictions by IDC and others about mirrorless reaching 13 million units by 2014…).
True. But then, when those estimates for 2014 were made, everyone expected that the 2014 overall dslr/mirrorless advanced level camera market would have continued to grow. It didn’t. Any way you look at it, mirrorless cameras continue to increase their acceptance in the serious end of the market
Acceptance is all well and good but it does not translates into sales. Companies exist by selling products and if the market is stuck at 3 million units for years – it doesn’t help them if this means a larger percentage of (an ever dwindling) market.
I agree with Mike, clearly it’s a fact that mirrorless is the only category holding sales with DSLR and compacts taking significant losses. If the market is shrinking and they maintain it’s inappropriate to say that Mirrorless is not fulfilling. Based on the current trend, mirrorless will likely draw even with dslr in the next 5 years and surpass compacts.
If your level of expectations is so low that having a relatively small segment of the market which only goes down slightly in terms of sales year to year is considered a good thing, than you have a very low level of expectations indeed.
I can promise you that the investors in Canon, Nikon, Sony and Panasonic don’t look at “only loosing a little bit” on mirrorless (while loosing a ton on any other thing – including lenses b.t.w.) as a positive thing. The camera industry is a business and to continue supporting it (surly in the way that we have been used to) it needs to make money and not just make money – make more money each year (which hasn’t been happening for at least 4-6 years) so the investors, the board and the company leaders themselves will choose to continue to invest in this market and in the (very expensive) R&D that will give us significantly better cameras in years to come.
If you considered a 45% growth in market share a failure, I guess there is no convincing you.
Growth in the market doesn’t mean s&$%. Only growth in sales. And there has been no growth in sales only reduction (or stagnation).
Its better than that. It isn’t a”larger percentage of an ever dwindling market.” The actual numbers have held up as well. Considering the implications for assembly lines, costs etc., mirrorless are looking stronger. This is particularly significant when you consider the costs of mirrorles. They aren’t cheap. It’s the concept that is gaining ground in the high end section of the camera business. Further, and of course this takes us away from just analysing figures, mirrorless is now starting to move into medium format where they will have even more of an edge.
If your level of expectations is so low that finding out that a relativly small sagment of the market is only dropping slightly or at best remaining stagnent in terms of sales (and only due to the extreme decline of the total market – gains market share but does not sell more) you have very low expectations my friend.
I can promise you that this level of expectations isn’t that of the investors in Canon, Nikon, Sony or Panasonic and from a business standpoint (and the photo industry is definitely a business) this is not a positive point.
An increasing market share in a declining market isn’t really much to be happy about, if it doesn’t reflect actual growth in sales.
The promise of mirrorless wasn’t that it should stagnate, while the rest of the camera market was declining – the promise was that mirrorless would grow (in absolute terms, not relative) and steal sales from DSLRs. But the fact that the decrease in DSLR sales in recent years isn’t accompanied by a corresponding increase in mirrorless sales, clearly tells us that most of the consumers who abandoned the DSLR didn’t choose a mirrorless camera; instead, they chose something else, and that’s probably a smartphone.
True, that was the promise of mirrorless, but then, we all thought that the whole market would continue to expand. As it has turned out, the whole non phone market has declined. There still appears to be a market for advanced level cameras, although how big an eventual market remains to be seen. If I was a camera manufacturer and I made mirrorless, I’d definitely be happier to be maintaining my unit numbers rather than seeing them decline. I’d be happy to see that my share of the serious camera user market was increasing strongly and that shows in the figures we are discussing.
I don’t know anyone who bought a mirrorless camera as their first camera. Every single mirrorless user I know, and there are plenty of them, used to own a dslr. The mirrorless are sophisticated gadgets and are not designed for the compact camera market. They are mainly bought for the size factor. While many dslr users may be abandoning their gear for a phone, it is a certain bet that almost all mirrorless users have swapped from dslr. The mirrorless forums have no shortage of people saying exactly that.
I wrote this in 2013 and I think it’s pretty spot on still. We’re headed for a market of 2-5 million cameras/year in the next few years, I think.
https://photothunk.blogspot.com/2013/10/pictures-and-cameras.html
Your visualization looks nice but has multiple major problems that could be a proper example in the wikipedia entry about “Misleading Graphs”.
The bar graphs at the top left (“Amount of Total Cameras Manufactured by Year” and “Amount of Interchangable Lenses…”) do not symbolize the figures they’re labled with. Thats very obvious with the “22” bars in the right bar graph: They have different heights!
For example, in the “Amount of Total Cameras” graph, the bars of 61, 42 and 35 are up to twice as high as they should be (if you take the 100 bar as reference).
Further, in the “Amount of Interchangable…” graph: Why does the “31” bar not reach the full height (cmp. the “121” bar in the left graph)? The figures and corresponding bars symbolize different values – would a “31” bar not be about twice the height of the “15” bar? What is this? Graph painting 101?
The circular graphs in the middle of the top row (“DSLR vs. Mirrorless 2013-2016”) are improperly scaled. The circles’ areas do not correlate with the figure labels. The labels correlate with the radii instead. A bar graph would symbolize the magnitudes correctly. But since you chose to draw areas, more specifically: circles, you have to regard the correlation between a measurement of area, not of length, to symbolize the numbers correctly. Due to this mistake, your bigger circles are too big by nearly 30 per cent, compared to the smaller ones.
The bar graph at the bottom right is laughable – 52%, but way less than the half of the total width?
Please rework the whole thing!
Oh, and the pie charts at the bottom left: 25% are symbolized by a piece that is clearly bigger than a quarter circle – that cannot be right, does it?
Come on, dudes. Technical flaws like these really undermine your credibility!
These are done by hand (by our very capable graphic designer) there is not an algorithm making those and they are far from 100% accurate. Let me tell you another “secret” the total percentage in some cases is above or below 100% – why? because you sometimes get numbers which are 22.25 and the graph only states 22. Yes, these things are approximations – but the numbers themselves are correct and based on the official CIPA data – which you are welcome to read for yourself if you prefer simple boring tables (or at least rounded up or down to fit the size of the image in our infographic).
“These are done by hand” …
obviously
” (by our very capable graphic designer)”…
Oh, you’re able to use irony! I love it!
“there is
not an algorithm making those”…
you already said that at the very start.
“and they are far from 100% accurate.”
So you agree with me. Fine.
Listen: I don’t care whether you sketch your visualizations by hand or use a sophisticated statistics software, as long as your visual representations match the underlying numbers and avoid common pitfalls.
The main reason to show graphs instead of “boring tables” is that the reader is not forced to think about the magnitudes of the numbers, but can grasp the relations between the numbers instantly via graphs. Your faulty info graphic undermines this concept!
Btw. A link to the CIPA source you used is still missing in the article. (yeahyeahyeah, I could google it myself, but I could never be sure that my search result is the same as your data base).
There is a link to the CIPA site in the article – look again (you just need to choose which statistics you want to view).
Correct me if I’m wrong, but there are only two links to the CIPA site: A link to the pre-front page (language selection) and one to the members of CIPA.
That’s not enough to view the boring tables you used as basis for your info graphic. Why don’t you link the pdfs itselves?
Wow you are hard.
Here, I added direct links to both PDFs (there was just a single link originally).
A boring chart would be much preffered over this over-colored mess
Then go read the chart – you have the links.
Also that 52% is about the same width of the 32% on it’s left.
One comment: I think it would be worth noting somewhere on the chart that CIPA only counts shipments for Japanese manufacturers. That doesn’t really change the picture as regards trends over time etc., but it can have some minor impacts on the numbers.
For example, in 2010, the Korean manufacturer, Samsung, had a substantial camera business not counted by CIPA — certainly over 10 million units a year (almost all point-and-shoot digicams but also some ILC cameras), so global camera unit volume was actually significantly higher than 121 million in 2010.
Also, the Japanese manufacturers do not dominate one important segment of the camera business: action cameras, which are dominated by an American company, GoPro, and GoPro also does not participate in CIPA’s research program. (One might argue that action cameras are essentially video cameras, but I think they’re still worth looking at when trying to understand the standalone camera market.)
One more note for the future: As Chinese camera manufacturers, which are in their infancy now, take over a larger portion of the camera industry, CIPA figures will become less and less reliable as a proxy for the global camera business. (Unless the Chinese companies join CIPA’s research program, which seems very unlikely.)
We actually noted that in the Hebrew version of this article on MegaPixel.co.il (not sure why I didn’t include it in the video). I’ll add something in the text.
More to the point – at present CIPA numbers are very representative of the camera industry. Samsung did have some relatively small share of the market but as you said – mostly in compacts. I don’t see Chinese manufacturers getting a huge percentage of the market in the current decade (surely nothing above low single digit percent). As for action cameras – and that is true for drone cameras (and if you really want other types of cameras than security cameras as well) – I believe that they are treated differently (maybe indeed as video cameras although the borders are not clear anymore as you can shoot video with more or less any cameras these days).